**Note: The content in this article is only for educational purposes and understanding of cybersecurity concepts. It should enable people and organizations to have a better grip on threats and know how to protect themselves against them. Please use this information responsibly.**

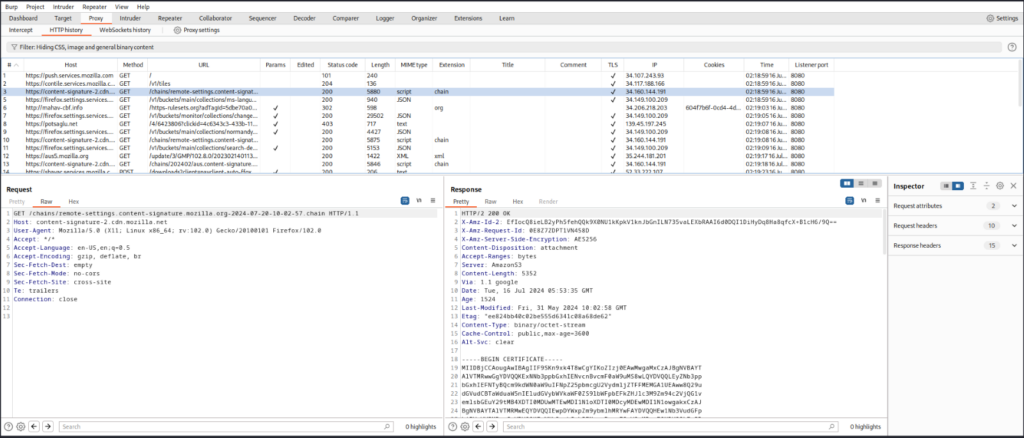
Burp Proxy’s HTTP history records all HTTP traffic, including any modifications made to captured messages. It provides the following details:
- #: Index number of the request.
- Host: Protocol and host name of the server.
- Method: The HTTP method used.
- URL: URL file path and query string.
- Parameters: Indicates whether the request contains any parameters.
- Modified: Indicates whether the request or response has been modified by the user.
- Status Code: The HTTP response’s status code.
- Length: The response’s total bytes of length.
- MIME Type: The MIME type of the response either it is script, XML, text,JSON, etc.
- Extension: URL file extension.
- Title: Page title (for HTML responses).
- Notes: Any notes used by the user.
- TLS: Indicates whether TLS is used or not.
- IP: The destination server’s IP address.
- Cookies: All cookies set in response.
- Time: The time when the request was submitted.
- Listener Port: The listener port that was used to receive the request.
- Start response timer: The time, measured in milliseconds, between submitting the request and getting the first response byte. End response timer: Time in milliseconds from sending a request to receiving a complete response.
- End response timer: Time in milliseconds from sending a request to receiving a complete response.
HTTP history is continuously updated even when Capture is turned off, allowing you to monitor key details of application traffic without interruption. Right-click on any item in the table to access additional options, such as sending requests to other Burp tools
HTTP History Layout
We can customize the HTTP history in various ways:
• Hide Columns: Right-click the column header you want to hide and select “Hide Column”.
• Show hidden columns: Go to the options menu, select “Table Layout” and select the columns you want to show.
• Move columns: Drag the column header to the desired location.
• Add Custom Columns: Click “Add Custom Column” in the options menu to create a new column to display specific data. Learn more about adding custom columns to HTTP history.
• Sort table: Click on a column header to sort by that column. You can sort in ascending, descending or unsorted order.
• Data filtering: Click on the Filter settings bar and choose between:
• Setup mode: Use predefined checkboxes and fields to set criteria. Read more about HTTP history filtering in Settings mode.
• Bambda Mode: Write a Java-based Bambda to create your own filter. Read more about HTTP history filtering with Bambdas.
• Restore Default Layout: To return the table to its original state, go to “Table Layout” in the options menu and select “Restore Default Table”.
Viewing Request
When you select an item from the HTTP history, the request and response messages for that item are displayed in the lower pane. Any modifications to these reports are displayed separately and may be due to:
• Eavesdropping on the user.
• Automatic response adjustment.
• Merging and replacing the rules.
In addition to the main history view, we can:
• Double-click an item to open it in a separate dialog box.
• Right-click on the request and choose “Show new history window” to open a new history window with a custom view filter.
• You can easily view and edit items of interest using the Inspector.
• View and edit your notes by clicking “Notes”.
Adding a Custom Column
With Bambdas, you can create custom columns to get a more detailed view of your HTTP history, allowing for more targeted analysis of what’s important to you. The Montoya API provides two objects to help write these Bambdas:
• ProxyHttpRequestResponse
• Utilities
To create a custom column for the HTTP history table:
• In HTTP History, click the option menu and select “Add custom column”. This will open the Add Custom Column window.
• Enter a custom column name in the Column Header field.
• Write Bambda to define the data that will display the custom column.


