**Note: The content in this article is only for educational purposes and understanding of cybersecurity concepts. It should enable people and organizations to have a better grip on threats and know how to protect themselves against them. Please use this information responsibly.**
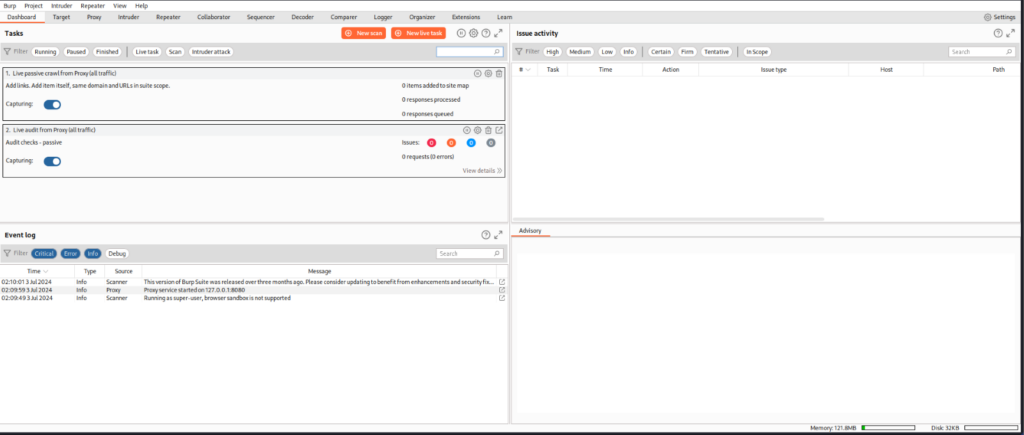
In the last part of BurpSuite Dashboard – part1, we discovered how we can perform scan and crawl through the whole web application. Now, there are other options available that can help us to get more information about the web apps.
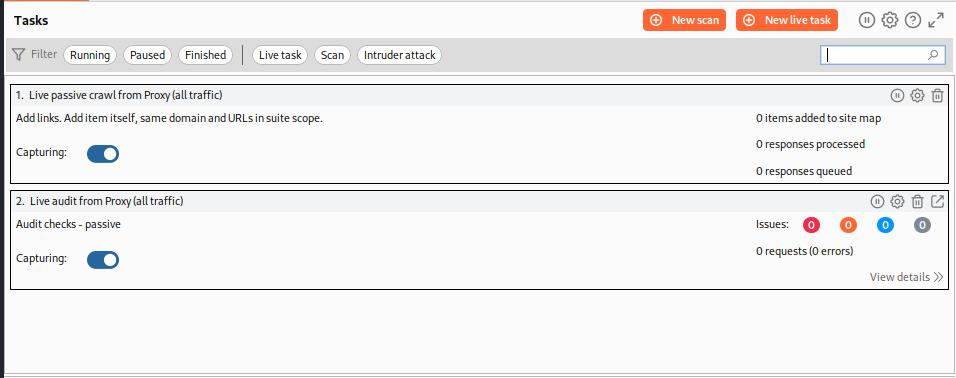
- Tasks Tab
Each task is listed in the Tasks section, providing essential details for monitoring progress. Additionally, for live tasks, you have the option to enable or disable traffic capture. For further details about a specific task, click on the corresponding entry. For a comprehensive view of scan and live task results, refer to the relevant documentation.
- Event Log
As tasks progress, key events are logged, including start time, alerts, and progress updates. This log provides valuable information for troubleshooting any issues with your scans. You have the option to view either a task-specific event log, which records events related to individual tasks, or a project-level event log that aggregates entries from all tasks within your project.
To access the project-level event log:
- Navigate to the Dashboard tab.
- From the bottom dock, select ‘Event log.’
For a task-specific event log:
- Visit the Dashboard tab.
- Choose the relevant task from the Tasks list.
- In the main panel, go to the ‘Event log’ tab.
Each entry in the event log has the following details:
- Time: Timestamp of the event.
- Type: Indicates whether it is critical, an error, informational, or for debugging.
- Source: Identifies the task number or triggering tool.
- Message: A concise summary of the event

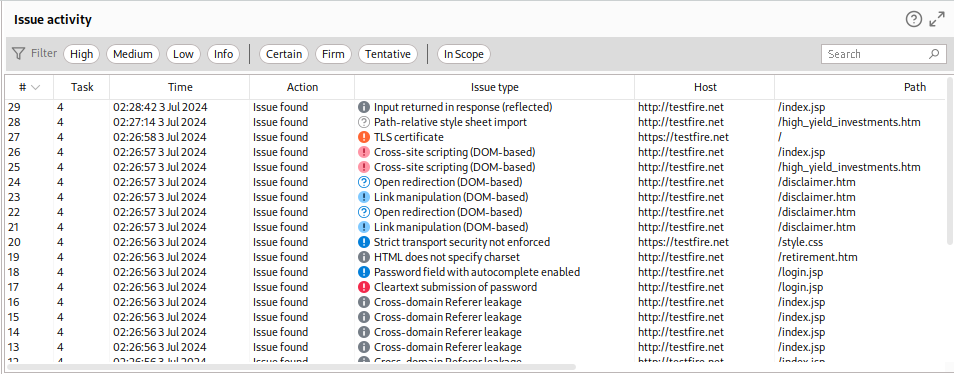
- Issue Activity
When Burp Scanner detects a potential vulnerability during auditing, it logs the issue in your project file along with relevant details for resolution or manual investigation. You have two options for viewing these issues:
- Project-Level Issues List:
- Go to the Dashboard tab.
- From the bottom dock, select ‘All issues.’
- Task-Specific Issues List:
- Visit the Dashboard tab.
- Select the relevant task from the Tasks list.
- In the main panel, navigate to the ‘Issues’ tab.
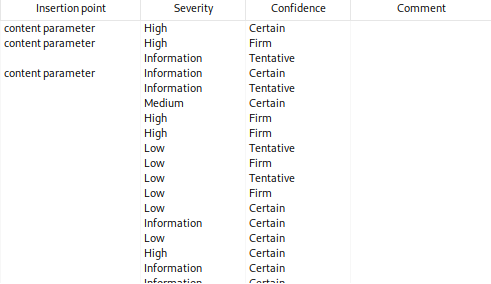
In the Issues table, each entry includes the following information:
- Time: Timestamp when the issue was found.
- Source: The task responsible for identifying the issue.
- Issue type: Description of the vulnerability.
- Host: The server where the issue exists.
- Path: URL path to the issue location (if applicable).
- Insertion point: Type of insertion point used in the request that discovered the issue.
- Severity: High, medium, low, or informational.
- Confidence: Tentative, firm, or certain.
- Comment: User-applied comments (double-click to add/edit)
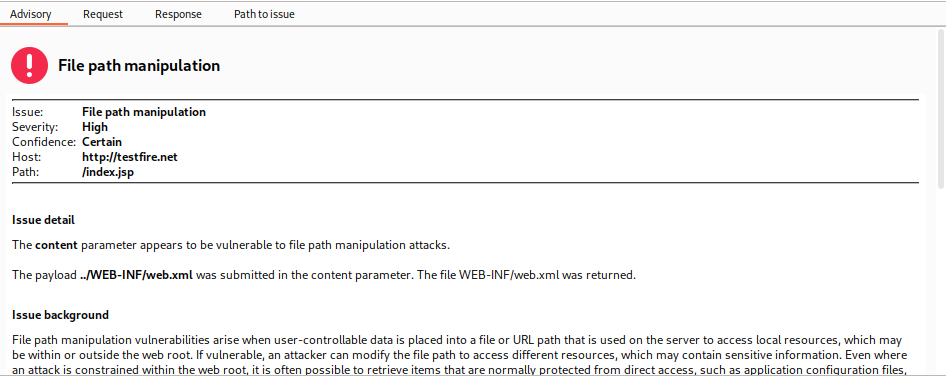
- Advisory tab
When examining the details of a specific issue, the issues window presents various tabs. Depending on the issue type, the displayed tabs may vary, but the Advisory tab is consistently available.
- Displays essential information about the issue:
- Severity level.
- Confidence in the issue’s presence.
- Host and URL path where the issue was detected.
- Indicates whether an extension identified the issue.
- Collapsible headings provide additional specifics related to the issue (only relevant headings are shown):
- Issue description.
- Issue detail.
- Issue background.
- Issue remediation.
- References.
- Vulnerability classifications.
Request and Response Tabs:
- These tabs showcase snippets of the HTTP requests and responses where the issue occurred.
- You may encounter a single request and response or a series of interconnected ones leading to the issue.
- Key portions of each request and response are highlighted in red for analysis. This includes payloads injected by the scanner and confirmation strings or regex patterns in the response.
